Every screen, one job: make your ad spend accountable per product.
Twelve surfaces, from the executive dashboard down to a single SKU's run history. All fed by the same immutable runs.
Dashboard
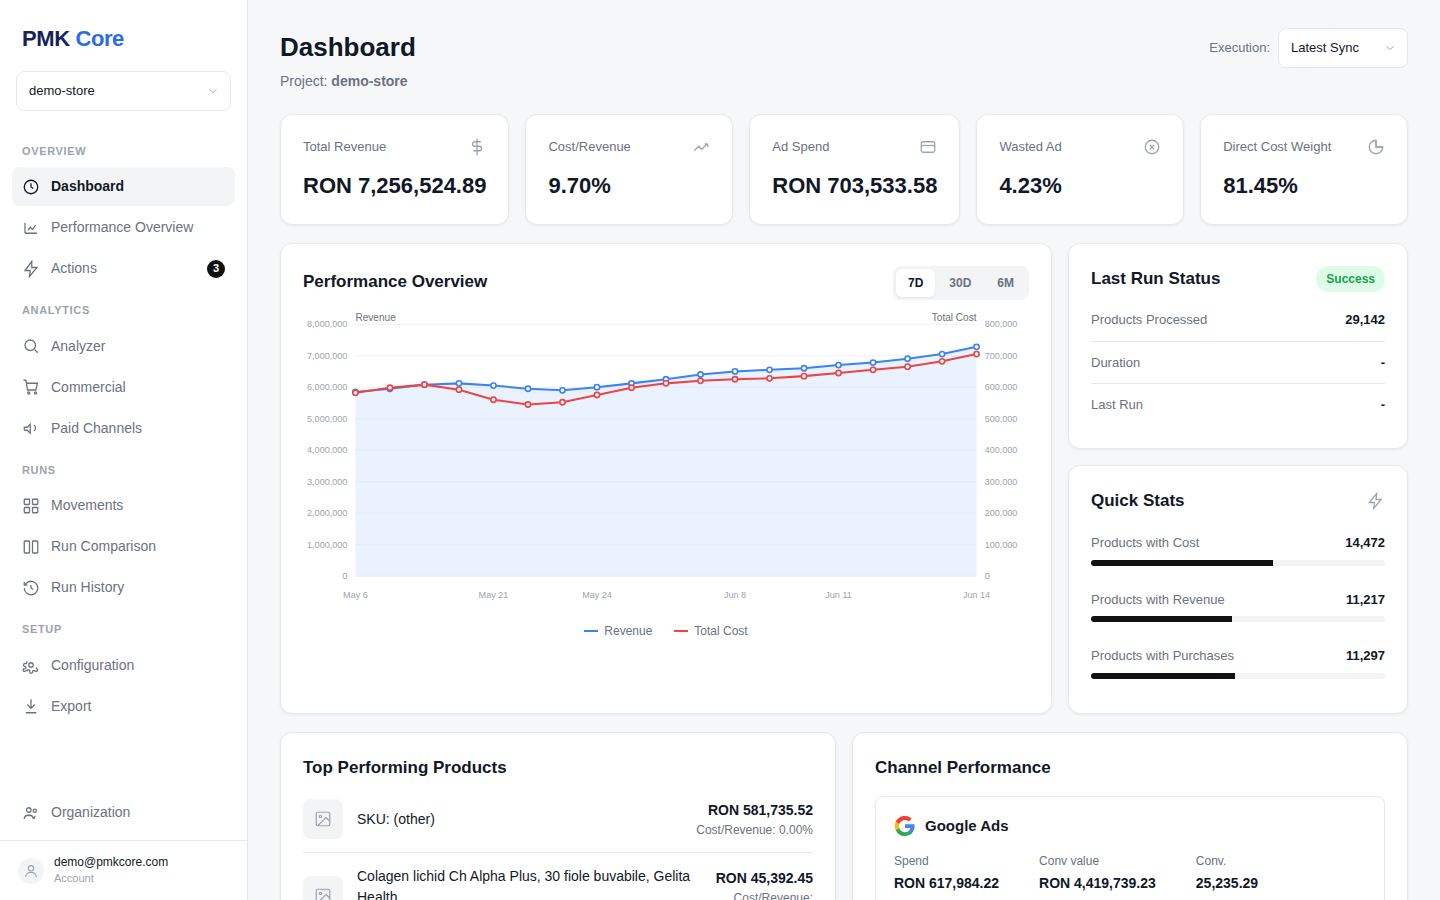
Revenue against ad cost at a glance — with the numbers platforms don't show you.
- Total revenue, cost/revenue ratio, ad spend, and wasted ad % as first-class KPIs
- Revenue vs total cost timeline across 7 days, 30 days, or 6 months
- Top performing products and per-channel spend snapshot
- Direct cost weight: how much of your spend is actually attributable to products
Performance Overview
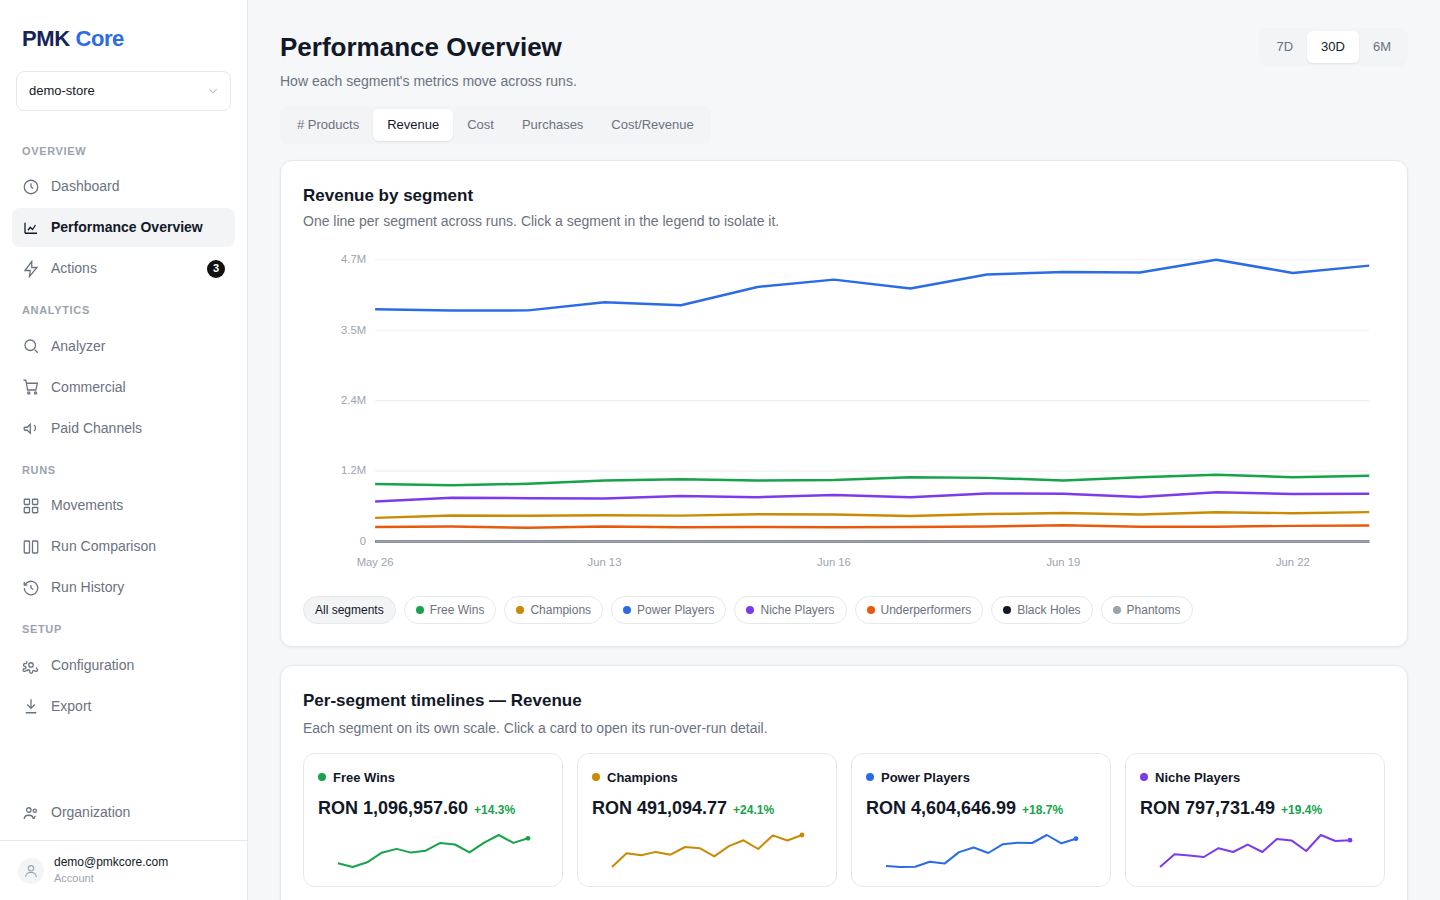
Each segment's trajectory across runs — which way is your catalog moving?
- A timeline per segment: products, revenue, cost, purchases, cost/revenue
- Overlaid all-segments chart with click-to-isolate
- Per-segment cards on their own scale, with change over the window
- Segment metrics table with trend arrows vs the previous run
Analyzer
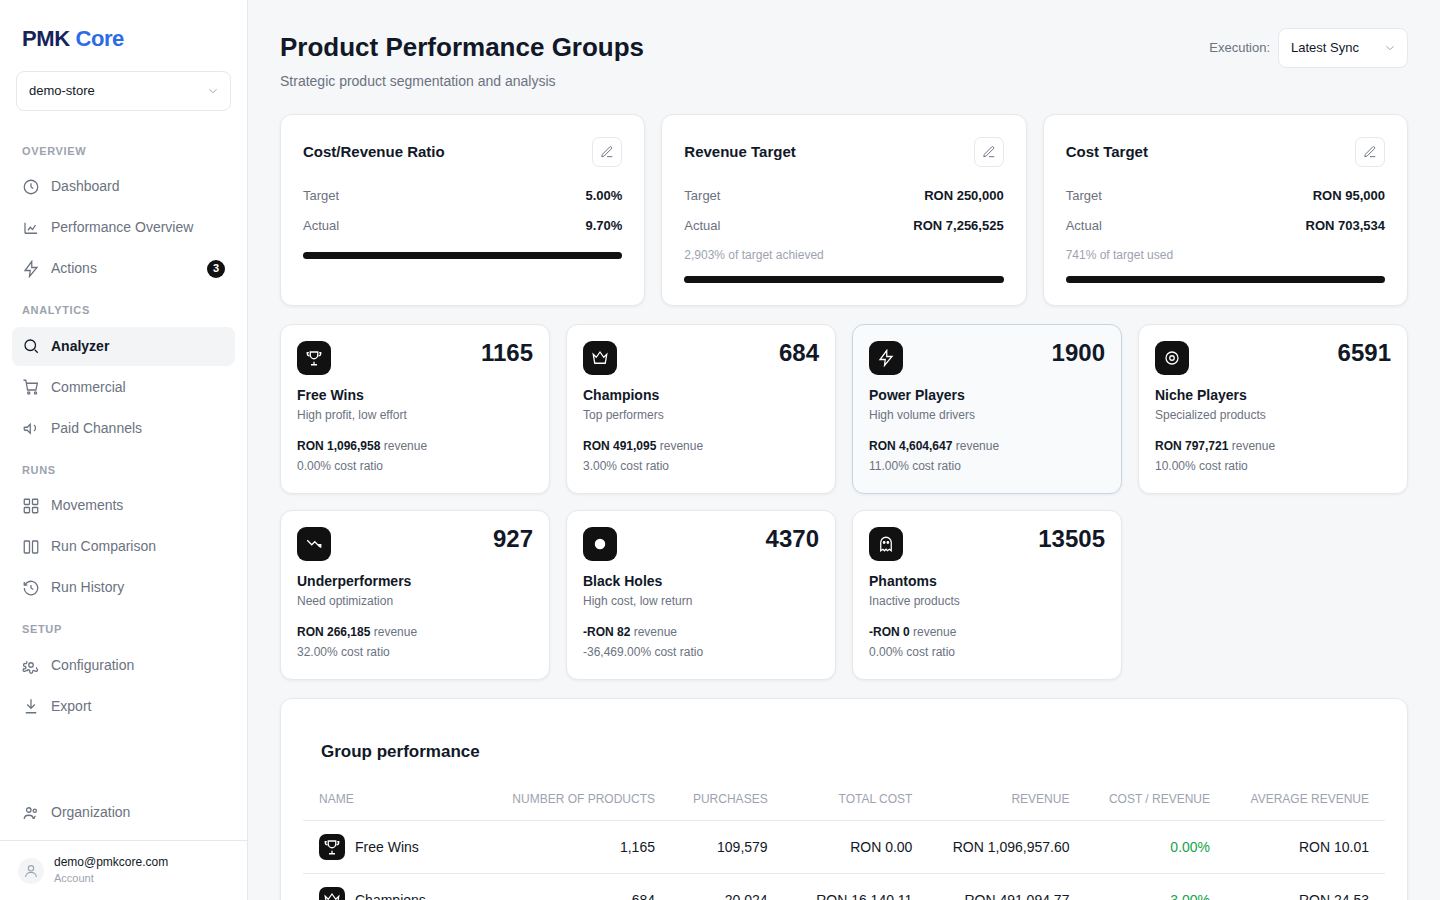
The segmentation engine over your full catalog — every product, one segment, one action.
- Dual ranking: ad cost on one axis, revenue + purchases on the other
- Seven segments from Free Wins to Phantoms, with counts, spend and revenue per group
- Full product table: search any SKU, see cost, revenue, purchases, cost/revenue
- Targets on top: cost/revenue ratio, revenue target, cost budget
Commercial Analytics
The same profitability lens, rolled up the way merchandisers think.
- Breakdowns by product, brand, category, and custom label
- Cost, direct cost, revenue, cost/revenue and average revenue per group
- Spot the brand or category quietly running triple your target ratio
- Totals reconcile to the run — every screen agrees with every other
Paid Channels & Grey Holes
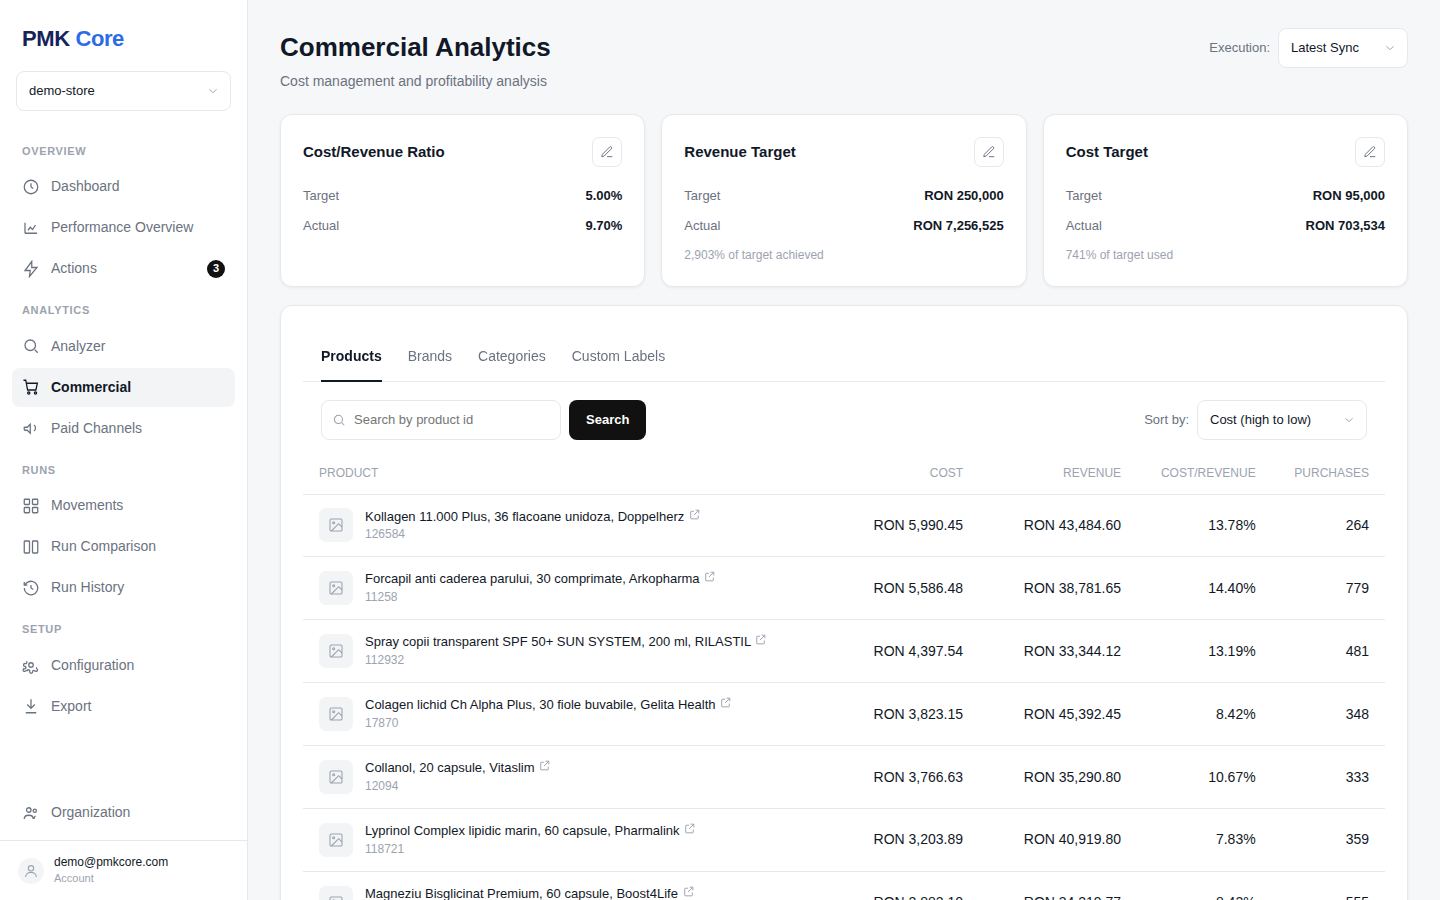
Google vs Meta, per product — including the conversions your database never saw.
- Per-network cost, conversions, conversion value, and wasted spend ratio
- Direct vs indirect cost split per network and per product
- Network drill-down reconciles platform claims against database truth
- Grey Holes: products the network says converted, with zero recorded purchases
Product Detail
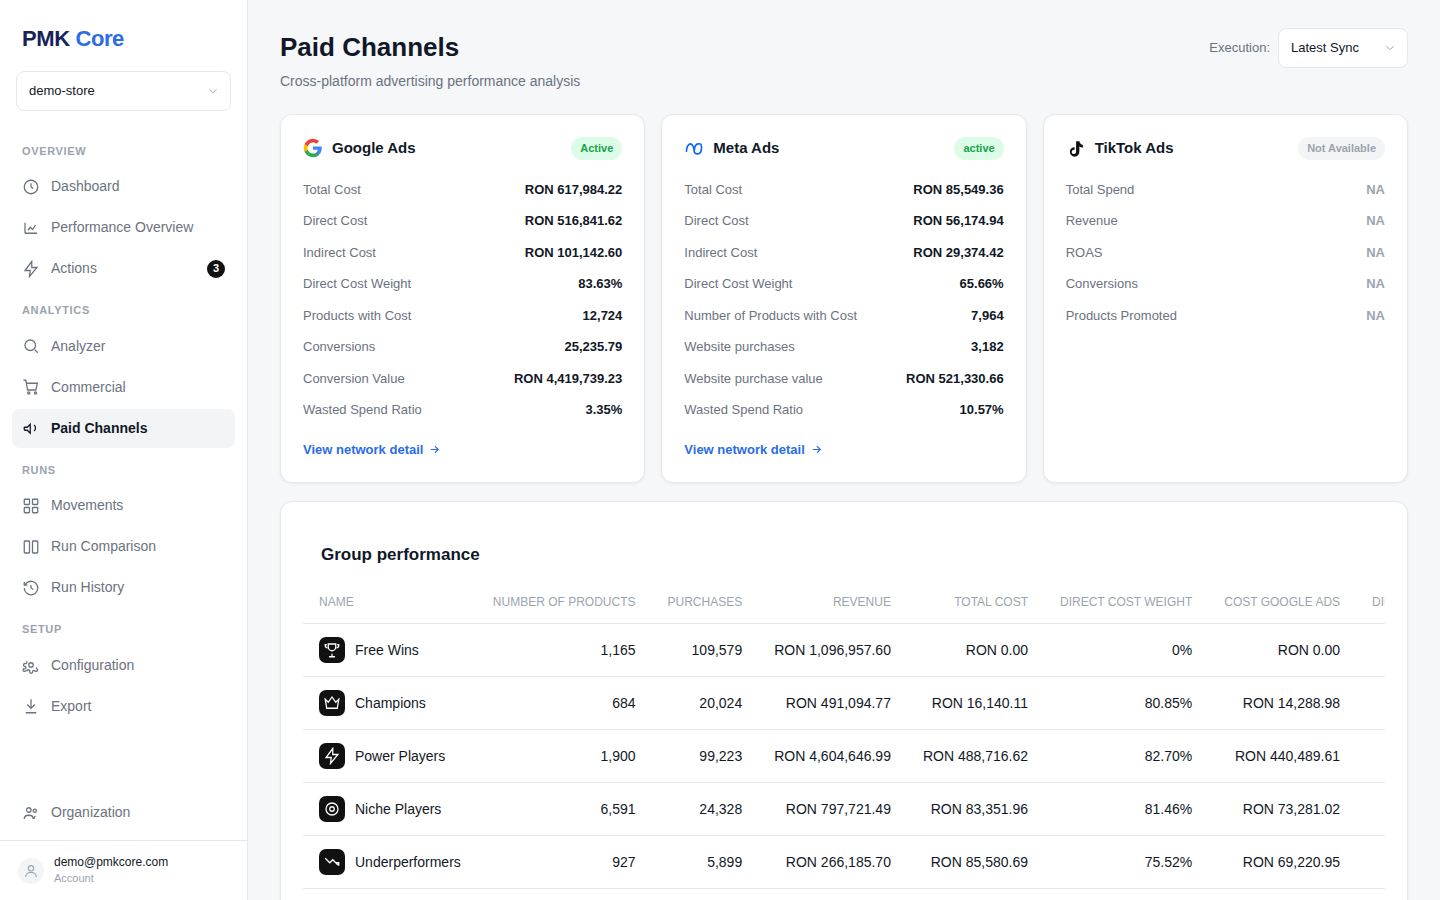
Click any product anywhere and get its full story — and the why behind its segment.
- KPIs for any run: cost, revenue, purchases, cost/revenue vs target, ROAS
- Pareto position: exact rank and percentile on both axes
- Run-presence timeline: segment color per run, absences visible
- Contextual recommended actions per product
Movements
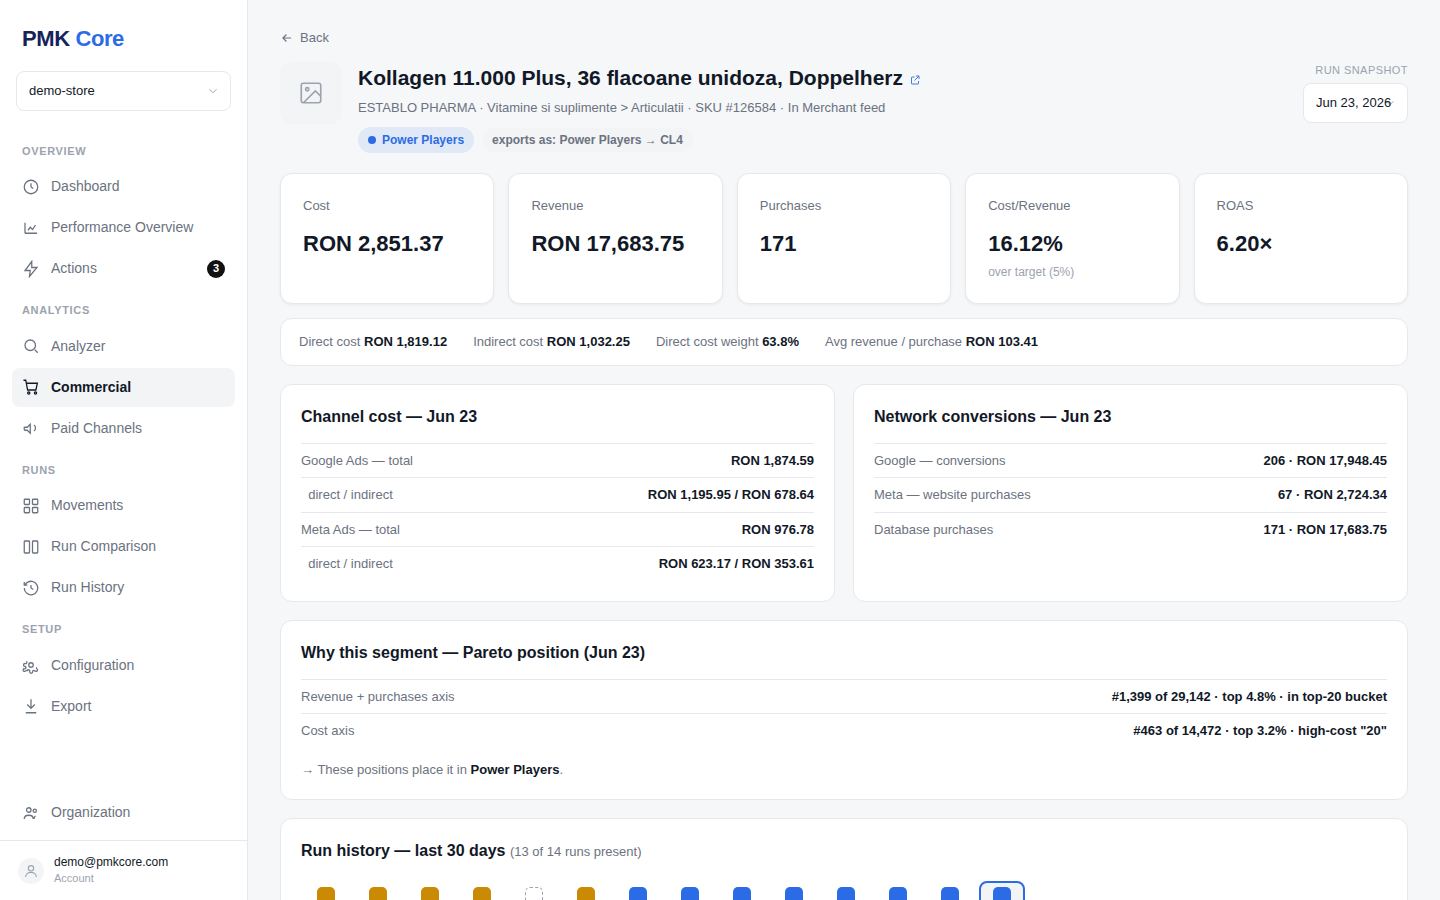
Between any two runs: what entered, what left, what got worse.
- Transition matrix across all seven segments, entered and removed included
- Top movements by product count, revenue delta, or cost delta
- Click any cell to list the exact products behind it
- Catch regressions early: what slid into Black Holes this week?
Run Comparison & History
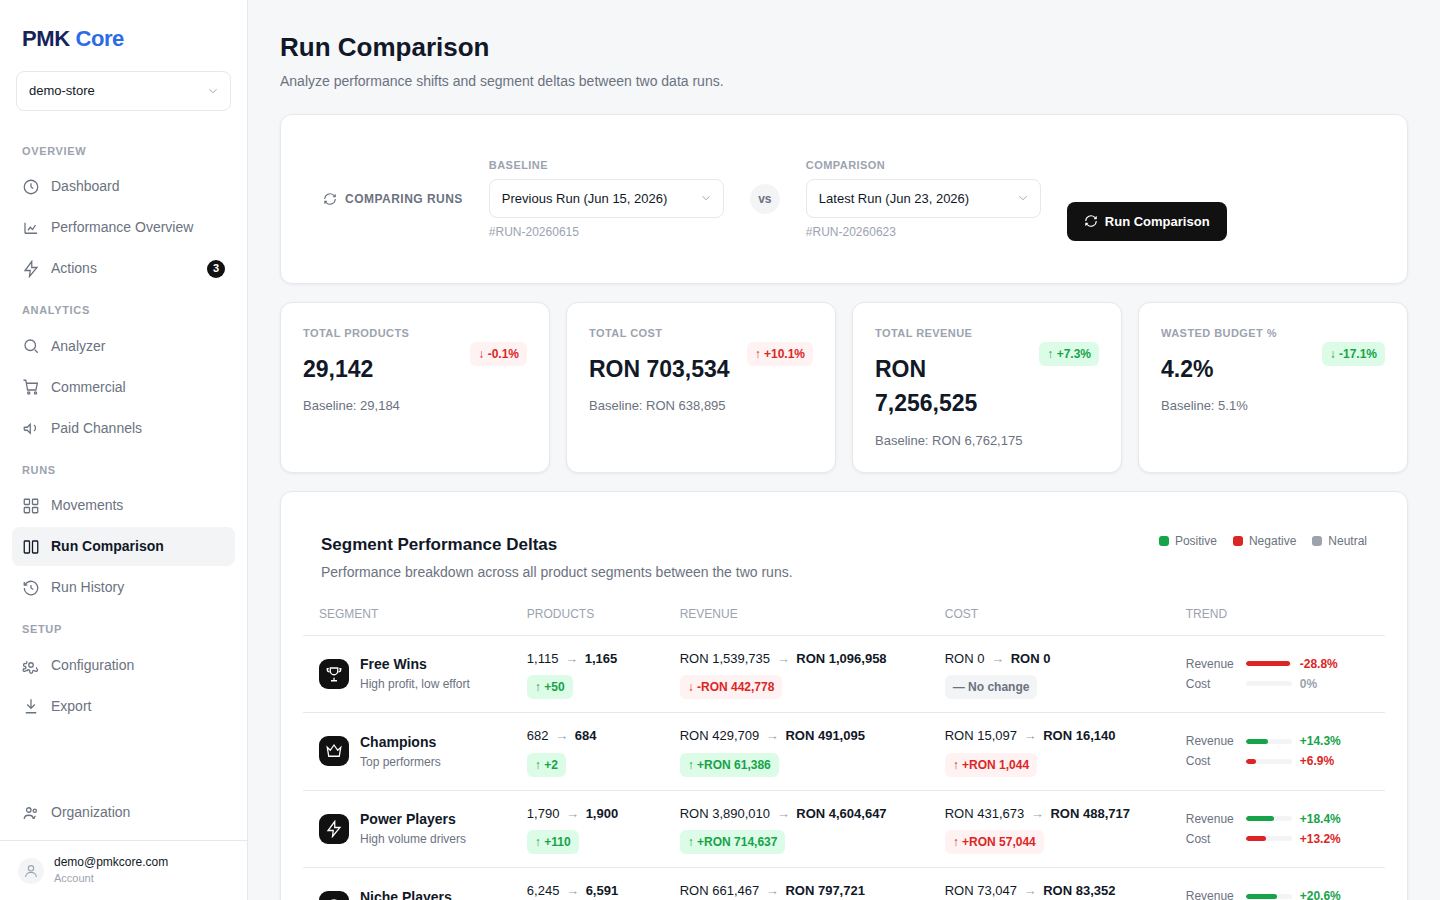
Every run is an immutable snapshot. Compare any two, audit them all.
- Baseline vs comparison: products, cost, revenue, wasted budget deltas
- Segment performance deltas across the board
- Run history with match statistics: products with cost, with revenue
- Runs are the unit of analysis — and the unit of pricing
Actions
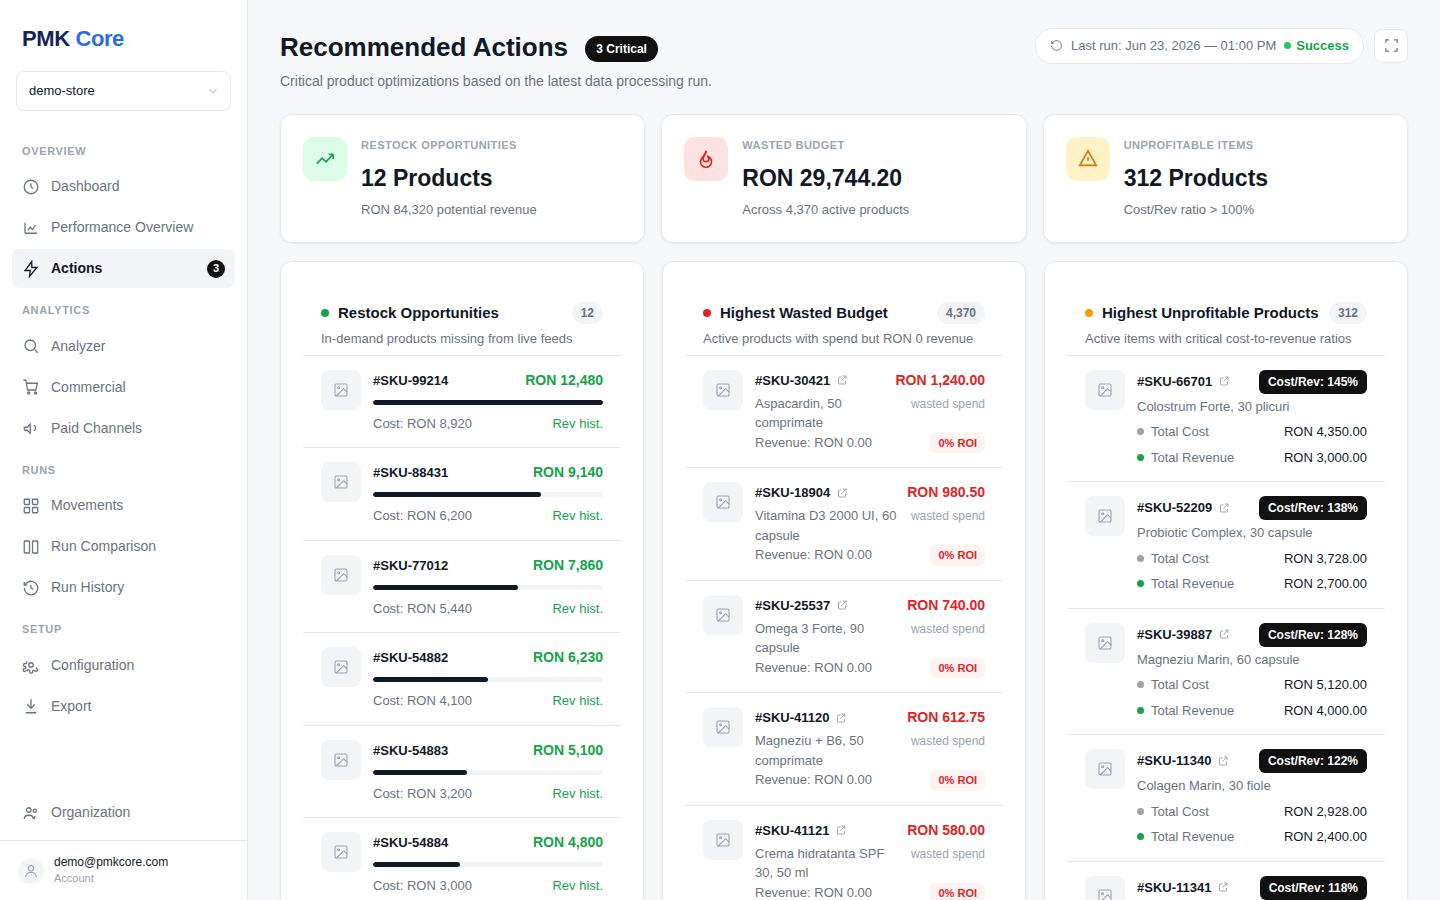
The latest run, translated into a prioritized to-do list.
- Critical items first: the Black Holes worth cutting today
- Grey Holes flagged for attribution review before you cut them
- Scale opportunities among Champions still under target
- Each action links straight to the products behind it
Export & Supplemental Feeds
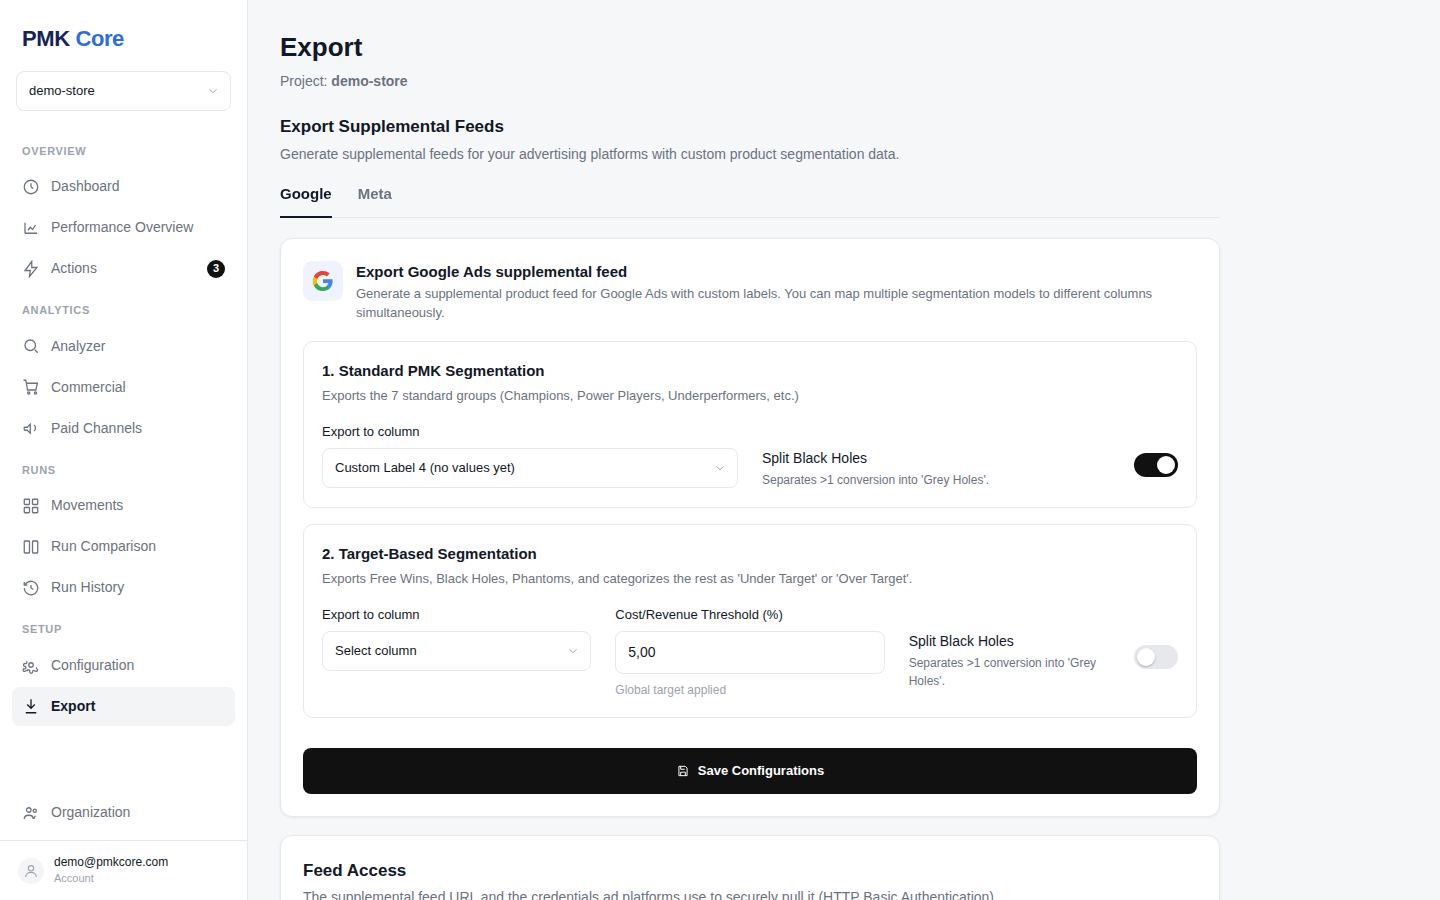
Segments don't stay in a dashboard — they go back into the ad platforms.
- Google and Meta supplemental feeds with your segments as custom labels
- Choose the label column; optionally split Grey Holes from Black Holes
- Feeds update on schedule and stay valid — set once
- HTTP Basic credentials for the platforms to pull securely
Configuration & Integrations
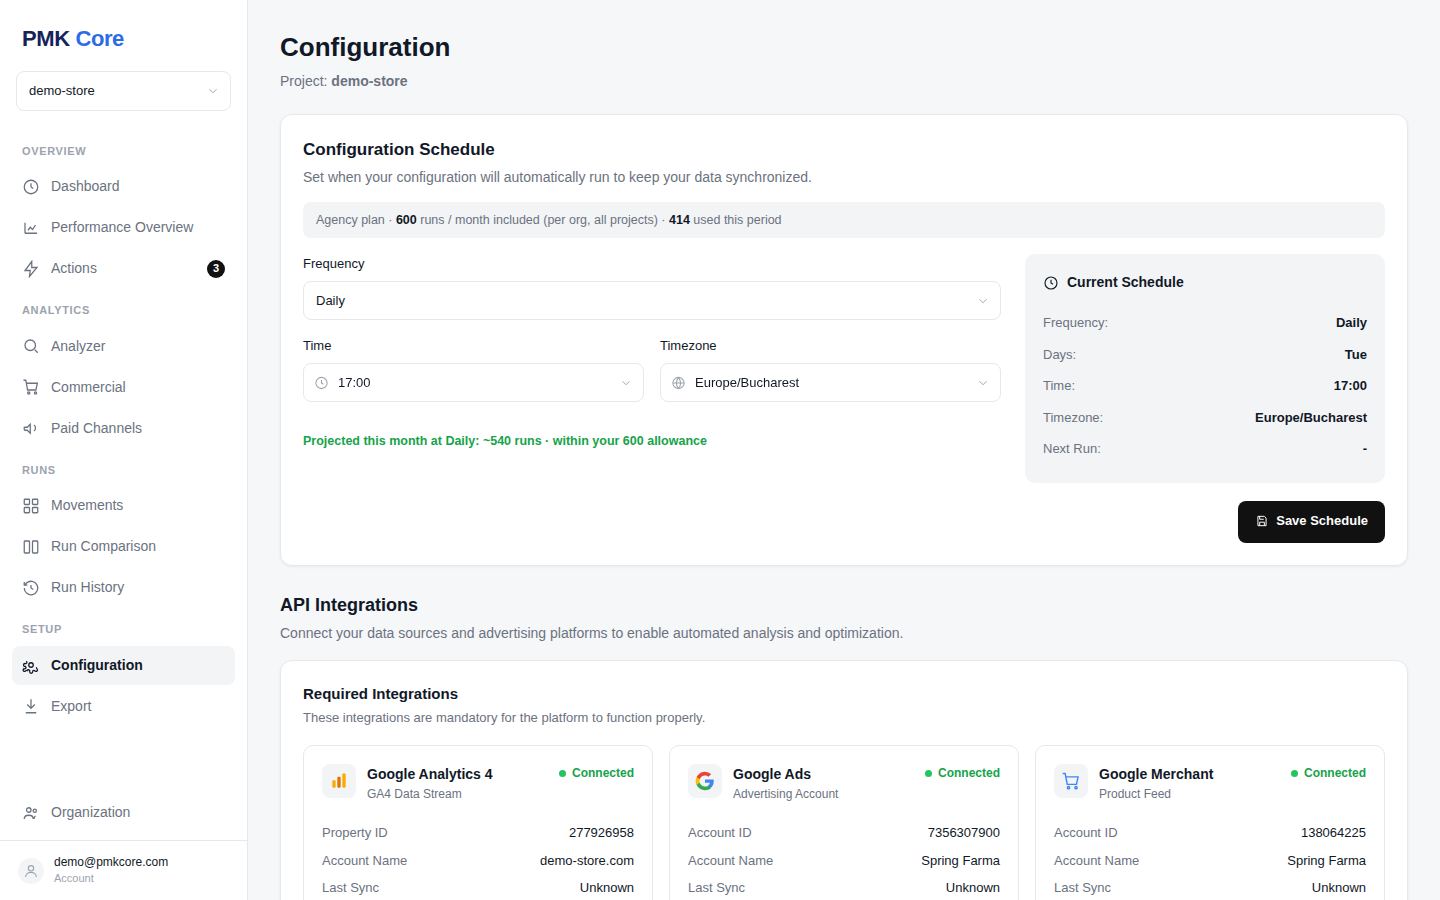
Connect once, then let the schedule do the work.
- Required: Google Analytics 4, Google Ads, Google Merchant
- Optional: Meta Ads today, TikTok Ads next
- Sales and COGS data via CSV or Google Sheet for database-truth revenue
- Scheduling with plan-aware limits — daily, weekly, or manual
Organization & Roles
Built multi-tenant from day one — one org, many projects, clear roles.
- Organizations own projects; each store is a project
- ADMIN, EDITOR and VIEWER roles per organization and per project
- Give clients read-only access to their own numbers
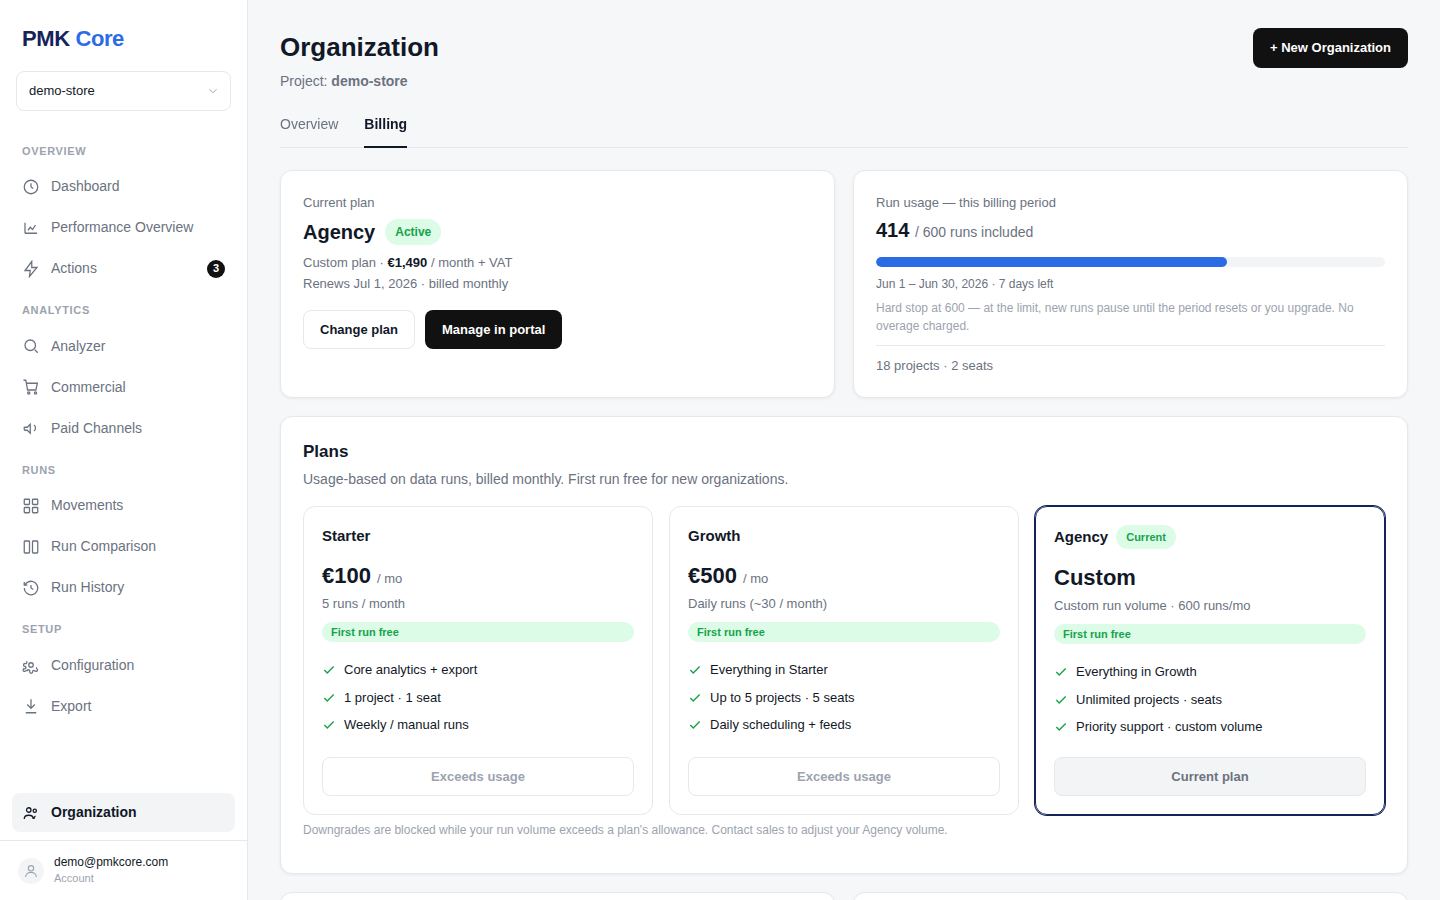
- Runs and billing are counted at the organization level